
For release October 10, 2023
September ISM-Houston Business Report
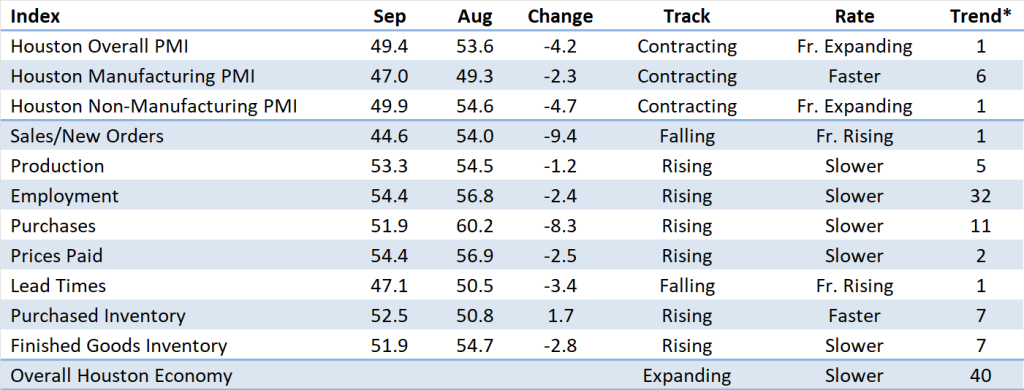
Houston PMI at 49.4 (down 4.2 points)
Sales/New Orders Contracting
Production Expanding
Employment Expanding
Prices Paid Expanding
Lead Times Contracting
Finished Goods Inventories Expanding
(Houston, Texas) – According to Houston area supply chain executives, economic activity in Houston contracted at a very modest pace in September. Manufacturing reported contraction at a moderately faster pace and nonmanufacturing moved from expanding to very minimal contraction.
The Houston Purchasing Managers Index fell 4.2 points to 49.4. Two of the three of the underlying indicators that have the strongest positive correlation with the Houston economy (sales/new orders and lead times) are now pointing modest to strong contraction. The third indicator with a strong positive correlation to the economy continues to point to modest to strong economic expansion. The sales/new orders index fell 9.4 points to 44.6. The employment index fell 2.4 points to 54.4. The lead times index fell 3.4 points to 47.1. The finished goods inventory index, the underlying indicator that has the strongest inverse correlation with economic activity, fell 2.8 points to 51.9, giving a weaker signal of potential economic contraction.
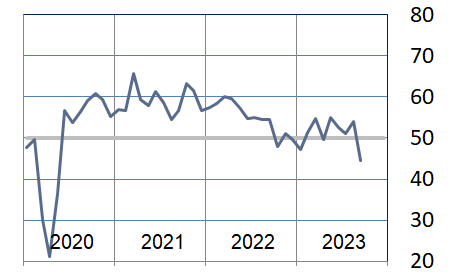
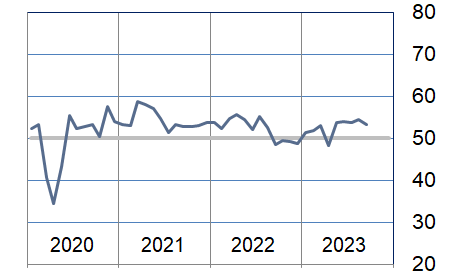
The Houston Manufacturing PMI fell 2.3 points to 47.0, providing a stronger indication of contraction in this sector. The nonmanufacturing PMI fell 4.7 points to 49.9, showing a minimal indication of contraction for the industries in this sector.
On an industry specific basis health care, professional and management services, and construction reported moderate to strong expansion. All other sectors are now reporting modest to strong contraction.
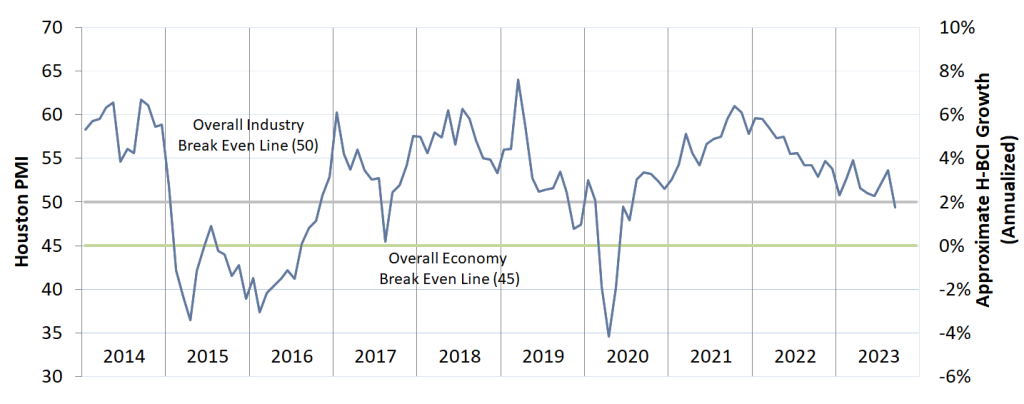
The Houston PMI provides a measure of current economic activity in the greater Houston area and a forecast of likely shifts in activity over a three-month forecast horizon. These indicators have a possible range of 0 to 100. Readings over 50 generally indicate goods producing industry expansion; readings below 50 show contraction. A PMI above 45 generally correlates with expansion of the Houston-The Woodlands-Sugar Land Business Cycle Index. The current and forecast PMI indices are based on diffusion indices for eight underlying indicators: Sales/New Orders, Production, Employment, Purchases, Prices Paid, Lead Times, Purchase Inventory, and Finished Goods Inventory.
Click here to see the PDF version of the full report.
Indices at a Glance
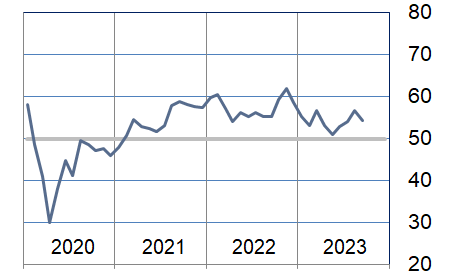
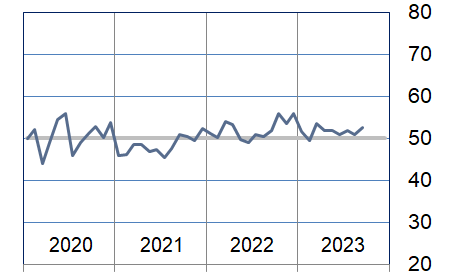
Houston PMI Trend
Houston PMI readings over 50 generally indicate that respondents see their activities as expanding. An HPMI above 45 normally correlates with expansion of the Houston-The Woodlands-Sugar Land Business Cycle Index (H-BCI).
Commodities Reported to have Notable Price Changes or to be in Short Supply
Up in Price: General labor, craft labor, temporary labor, field-based labor in remote operations, construction services, professional services; offshore deepwater rigs; crude oil, diesel, propane, natural gas liquids, ethane, propane, natural gasoline, naphtha; ethylene, propylene, elastomers, ammonia; pumps, valves, switchgear, motor control centers, transformers, electrical gear and components, instrumentation, automation equipment; software.
Down in Price: Onshore rigs; chlorine, caustic soda; silver for catalysts; carbon and stainless-steel pipe, lined pipe; vehicles; containerized ocean freight.
In Short Supply: General labor, craft labor, light industrial labor; COVID and flu test kits; fluoropolymers (PFAs), some non-metallic commodities, specific sizes of low temperature piping materials; HVAC, generators, switchgear, motor control centers, electrical gear, electrical components, electrical equipment, instrumentation, automation products, temperature gauges; offshore vessels.
‡ reported as up or down by different respondents
What our Respondents are Saying
Oil and Gas Exploration, and Key Support Services:
- Onshore rig costs are trending down slightly in 3Q-4Q.
- Year-on-year inflation is likely to be in the high single digits by 4Q23.
- September is always a slow month, but activities will pick up in October.
- We are getting ready for the end of the year by getting all the contracts ready for services that start in January.
- This sector’s performance fell to indicating contraction at a modest pace; the employment and purchases indices contracted at strong rate; the prices paid index showed expansion at a faster rate; all other indices were reported near neutral.
Construction:
- A shortage of experienced skilled labor and professional staff remains a challenge.
- Performance in this sector continued to show modest to strong growth led by continued strong growth in the employment index; the prices paid and lead times continued to show potential contraction.
Durable Goods Manufacturing:
- New orders are very slow; we are hyper-focused on reducing all inventories.
- Incoming sales orders this month were down from previous months, however, our backlog remains strong and manufacturing activity is up as a result.
- Commodity prices remain mostly stable again this month, but we remain cautious as ongoing inflation remains an ongoing factor.
- This sector’s performance eroded significantly to report well below neutral month over month; the sales/new orders and lead times indices reported well below neutral; the inventory indices showed continued expansion at a rapid pace; all other indices came in near neutral.
Non-durable Goods Manufacturing:
- Supplier fabrication shops for engineered equipment continue to have huge backlogs, minor changes in lead-times.
- Demand for chemical products is anticipated to be low in 4Q23 and 1Q24.
- Fuels pricing is trending down from summer highs.
- This sector’s performance stayed near neutral with support from strong production, prices paid, and lead times indices; the sales/new orders, employment, purchases indices were all reported as contracting at a moderate to strong pace; finished goods inventories fell.
Trade, Transportation, and Warehousing:
- Commercial real estate and financial institutions will soon be impacted when notes come due and vacancies are at a high level in major cities.
- This sector’s performance fell below neutral during the month with the sales/new orders and purchases indices showing significant contraction; the prices paid index continued to point to expansion; all other indices were reported near neutral.
Real-Estate Services:
- New and existing home listings slowed further.
- New home sellers continue to use loan rate buydowns.
- Apartment rental rates remain strong.
- This sector’s performance fell further below neutral with home sales falling below neutral; industrial and retail real estate reporting at neutral; office real estate continues to show significant weakness.
Health Care:
- We have had elevator installation labor issues.
- Suppliers in healthcare and construction have improved their supply chain and we are seeing decreases in time to procure and manufacture.
- Everything is going up in price due to cost-of-living adjustments (COLA).
- We are actively negotiating prices based on our total parent company volume to combat price increases and get better pricing; significantly increasing our spend under control has helped our negotiating power significantly.
- Healthcare is and will be in cost reduction mode for the next three to four years; we are seeing that pressure in our hiring; even though we are doubling in size over the next 24 months we are tasked to stay flat for non-revenue generating positions while we add revenue generating positions on the medical side.
- Do more with same or less is mantra; this puts pressure on employees already doing a lot more than usual.
- With the slight rise in COVID cases, we are experiencing an increase in usage of medical and surgical supplies; additionally, we are experiencing a shortage in test kits; we have increased stockpiling these supplies in anticipation of a very active Flu season.
- This sector reported continued strong growth; the employment index joined the sales/new orders, and purchases indices in showing considerable strength while the lead times index fell to indicating potential contraction; the inventory indices continue to run extremely high.
Professional and Business Services:
- Our market remains very stable.
- We are approaching budget season and don’t expect companies to be doing much direct hiring in the 4th quarter.
- We expect companies will look to hourly professional services a little more actively in the 4th quarter.
- It is amazing that with oil prices at the $90/bbl level there is no excitement about significant increases in staffing; this indicates that there is little confidence that the price will remain near this level.
- Instability and inflationary concerns continue to negatively impact hiring of direct employees, consultants, and temporary workers.
- Companies remain cautious about adding any type of labor cost; every role must be justified before hiring takes place.
- This sector reported modestly lower expansion this month with continued strength in the employment and purchases indices; the lead times index joined the sales/new orders index in reporting significant contraction; all other indices were reported near neutral.
Government:
- The majority of the commodities we buy are returning to normal supply conditions.
- This sector’s performance fell to near neutral; the purchases and inventory indices were reported as well above neutral while all other indices came in near neutral.
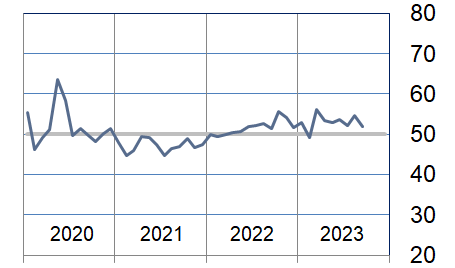
Trend of Underlying Indicators
The Houston PMI is based on diffusion indices for eight underlying indicators. The net value of each indicator is simply the percentage of respondents who cite a positive shift from the previous month minus the percentage who cite a negative shift. The diffusion index is calculated based on the percent of respondents reporting higher results plus one-half of those responding the same with seasonal adjustments to the Sales/New Orders, Production, Employment, and Prices Paid indices based on an X13 ARIMA forecast. Values above 50 for Sales/New Orders, Production, Employment, Prices Paid, and Lead Times generally point towards expansion and values below 50 signal contraction. Note that the Prices Paid Index may not follow this trend late in an economic expansion. The Inventory measures have an inverse correlation at most forecast horizons, meaning that values below 50 point to expansion and values above point to contraction. The Purchases index is inversely correlated with economic activity at the three-month forecast horizon.
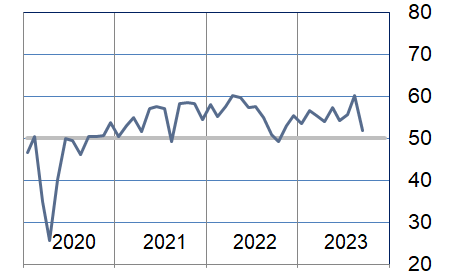
Sales/New Orders (Seasonally Adjusted)
The sales/new orders index fell well below neutral during the month with both manufacturing and nonmanufacturing reporting below neutral for the first time in over three years.
| Higher | Same | Lower | Net | Index | |
| Apr/23 | 12% | 81% | 7% | 5% | 49.6 |
| May/23 | 19% | 75% | 6% | 13% | 54.9 |
| Jun/23 | 11% | 80% | 9% | 2% | 52.9 |
| Jul/23 | 13% | 75% | 12% | 1% | 51.2 |
| Aug/23 | 16% | 78% | 6% | 10% | 54.0 |
| Sep/23 | 8% | 76% | 16% | -8% | 44.6 |
Production Index (Seasonally Adjusted)
The production index was relatively unchanged this month with both nonmanufacturing and manufacturing expanding at a modest pace.
| Higher | Same | Lower | Net | Index | |
| Apr/23 | 9% | 85% | 6% | 3% | 48.2 |
| May/23 | 11% | 86% | 3% | 8% | 53.8 |
| Jun/23 | 11% | 83% | 6% | 5% | 54.0 |
| Jul/23 | 17% | 74% | 9% | 8% | 53.9 |
| Aug/23 | 12% | 85% | 3% | 9% | 54.5 |
| Sep/23 | 11% | 84% | 5% | 6% | 53.3 |
Employment Index (Seasonally Adjusted)
The employment index fell to show a moderately lower expansion rate. Nonmanufacturing continues to show strong expansion while this index fell to below neutral for manufacturing.
| Higher | Same | Lower | Net | Index | |
| Apr/23 | 18% | 78% | 4% | 14% | 53.1 |
| May/23 | 12% | 80% | 8% | 4% | 51.1 |
| Jun/23 | 15% | 80% | 5% | 10% | 53.0 |
| Jul/23 | 14% | 82% | 4% | 10% | 54.0 |
| Aug/23 | 13% | 82% | 5% | 8% | 56.8 |
| Sep/23 | 14% | 80% | 6% | 8% | 54.4 |
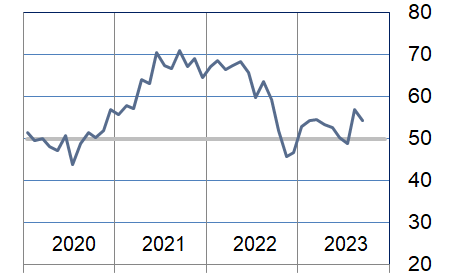
Purchases Index (Not Seasonally Adjusted)
The purchases index fell significantly to near neutral. Manufacturing continued to show weakness. Nonmanufacturing reported continued expansion at a much slower rate.
| Higher | Same | Lower | Net | Index | |
| Apr/23 | 17% | 74% | 9% | 8% | 54.1 |
| May/23 | 19% | 77% | 4% | 15% | 57.4 |
| Jun/23 | 14% | 80% | 6% | 8% | 54.3 |
| Jul/23 | 19% | 73% | 8% | 11% | 55.7 |
| Aug/23 | 27% | 67% | 6% | 21% | 60.2 |
| Sep/23 | 21% | 62% | 17% | 4% | 51.9 |
Prices Paid Index (Seasonally Adjusted)
The prices paid index fell modestly to indicate slower price expansion led by the nonmanufacturing sectors. Manufacturing prices expanded at a minimally slower rate.
| Higher | Same | Lower | Net | Index | |
| Apr/23 | 11% | 85% | 4% | 7% | 53.3 |
| May/23 | 13% | 78% | 9% | 4% | 52.6 |
| Jun/23 | 9% | 77% | 14% | -5% | 50.3 |
| Jul/23 | 8% | 82% | 10% | -2% | 48.9 |
| Aug/23 | 17% | 78% | 5% | 12% | 56.9 |
| Sep/23 | 12% | 85% | 3% | 9% | 54.4 |
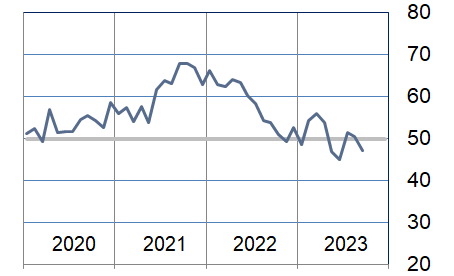
Lead Times Index (Not Seasonally Adjusted)
The lead times index fell below neutral lead by significant reductions in the nonmanufacturing sectors. Manufacturing reported modestly lower growth rates but remained above neutral this month.
| Higher | Same | Lower | Net | Index | |
| Apr/23 | 12% | 83% | 5% | 7% | 53.8 |
| May/23 | 8% | 78% | 14% | -6% | 46.9 |
| Jun/23 | 5% | 80% | 15% | -10% | 45.0 |
| Jul/23 | 12% | 79% | 9% | 3% | 51.4 |
| Aug/23 | 9% | 83% | 8% | 1% | 50.5 |
| Sep/23 | 6% | 82% | 12% | -6% | 47.1 |
Purchased Inventory Index (Not Seasonally Adjusted)
The purchased inventory index rose modestly during the month led by improvements in the nonmanufacturing sector. Manufacturing sector performance for this index remains modestly below neutral.
| Higher | Same | Lower | Net | Index | |
| Apr/23 | 12% | 79% | 9% | 3% | 51.9 |
| May/23 | 8% | 88% | 4% | 4% | 51.9 |
| Jun/23 | 8% | 86% | 6% | 2% | 51.0 |
| Jul/23 | 8% | 88% | 4% | 4% | 52.0 |
| Aug/23 | 6% | 89% | 5% | 1% | 50.8 |
| Sep/23 | 10% | 85% | 5% | 5% | 52.5 |
Finished Goods Inventory Index (Not Seasonally Adjusted)
The purchased inventory index to near neutral lead by significant inventory reductions in manufacturing. Nonmanufacturing was relatively unchanged at just above neutral.
| Higher | Same | Lower | Net | Index | |
| Apr/23 | 11% | 85% | 4% | 7% | 53.3 |
| May/23 | 9% | 88% | 3% | 6% | 53.0 |
| Jun/23 | 10% | 87% | 3% | 7% | 53.7 |
| Jul/23 | 9% | 86% | 5% | 4% | 52.1 |
| Aug/23 | 12% | 85% | 3% | 9% | 54.7 |
| Sep/23 | 9% | 86% | 5% | 4% | 51.9 |
Background on the ISM-Houston Business Report and HPMI Calculation Methods
The Houston Purchasing Managers Index has been included as an integral part of the ISM-Houston Business Report since the Houston chapter of the Institute for Supply Management started publication of this document in January 1995. The report and index are published monthly as the primary deliverables from a survey of Houston area Supply Chain leaders regarding the status of key activities believed to provide insight into the strength of the economy. The respondents come from diverse organizations including construction, energy, engineering, health care, durable and non-durable goods manufacturing, financial and business services, wholesale and retail trade, and utilities related companies.
The Houston Purchasing Managers Index is determined from diffusion indices of the eight indicators of economic activity covered by the ISM-Houston Business Survey and Report. These underlying indicators are sales or new orders, production, employment, purchases, prices paid for major purchases, lead times from sellers, purchased materials inventory (raw materials and supplies), and finished goods inventories. The respondents to the survey report the direction of each these activities as either up, the same or down in comparison to the previous month. An index for each of these areas is then calculated by subtracting the percentage of respondents that sight a negative shift from the percentage that sight a positive shift. For indicators that are positively correlated with economic growth, this results in an underlying index that points to expansion when it is above zero. Indicators that are negatively correlated with growth point to expansion when they are below zero.
The final Houston PMI is calculated by applying optimal regression factors to each of the eight underlying indicators noted above. These regression factors are determined using standard regression techniques comparing these underlying indicators to the Houston-The Woodlands-Sugar Land Business Cycle Index (Houston BCI), which is reported on a monthly basis by the Federal Reserve Bank of Dallas. This top-level index is converted to a 0 to 100 scale to match that of the national Purchasing Managers Index® (PMI®) which is published monthly by the Institute for Supply Management® (ISM®). Readings over 50 for the HPMI generally indicate manufacturing expansion in the Houston in the near term and readings below 50 show coming manufacturing contraction.
It is important to note that the manufacturing breakeven HPMI does not equate to the breakeven point for the overall Houston economy. ISM-Houston periodically reviews the capability of its correlations and adjusts the regression factors when appropriate. The most recent revision occurred as a result of a review undertaken during the third quarter of 2018, which determined that changes in the Houston economy over the last decade have shifted the intercept of the correlation, causing a neutral Houston PMI to no longer align with a neutral Houston BCI. A Houston PMI of 45 points now equates to a neutral Houston economy as measured by the Houston BCI. A similar offset between the National PMI and the National economy has existed for some time.
Use of ISM-Houston Business Report Content
All information contained in this report is protected by copyright laws and ISM-Houston retains all rights to this Content. ISM-Houston hereby grants you a limited, revocable license to access, print, and display this Content solely for your personal, non-commercial use. Requests for permission to reproduce or redistribute ISM-Houston Business Report Content can be made by contacting the ISM-Houston Business Survey Committee at hpmi@ism-houston.org.
ISM-Houston shall not have any liability, duty, or obligation for or relating to the ISM-Houston Business Report Content or other information contained herein, any errors, inaccuracies, omissions or delays in providing any ISM-Houston Business Report Content, or for any actions taken in reliance thereon. In no event shall ISM-Houston be liable for any special, incidental, or consequential damages, arising out of the use of the ISM-Houston Business Report.