
For release August 10, 2023
June ISM-Houston Business Report
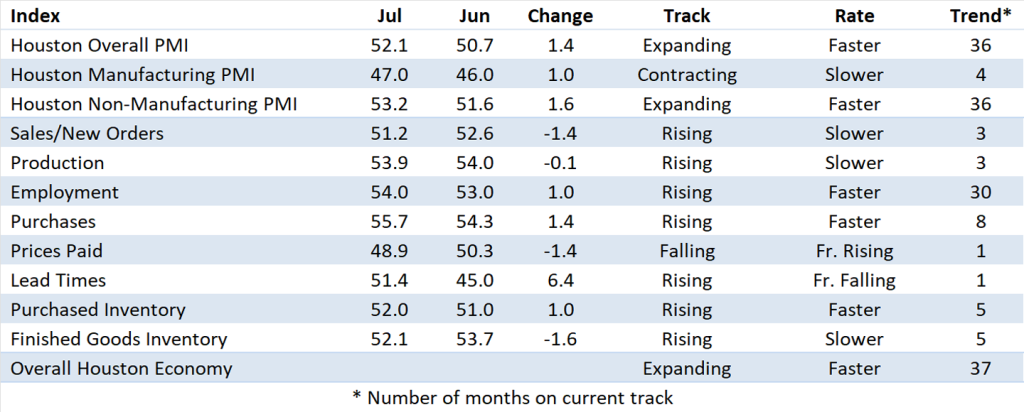
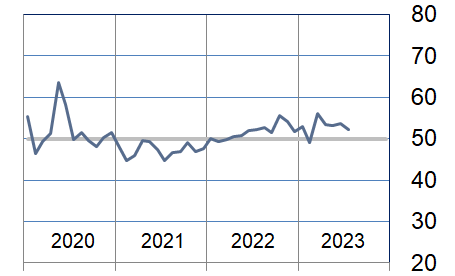
Houston PMI at 52.1 (up 1.4 points)
Sales/New Orders Expanding
Production Expanding
Employment Expanding
Prices Paid Contracting
Lead Times Expanding
Finished Goods Inventories Expanding
(Houston, Texas) – According to Houston area supply chain executives, economic activity in Houston expanded at modestly faster pace in July. Manufacturing reported contraction at a minimally slower pace while nonmanufacturing expanded at a faster rate.
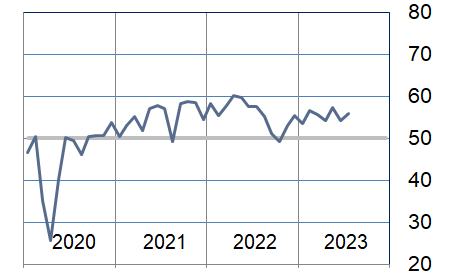
The Houston Purchasing Managers Index rose 1.4 points to 52.1. All three of the underlying indicators that have the strongest positive correlation with the Houston economy (sales/new orders, employment, and lead times) are now pointing to modest to strong economic expansion. The sales/new orders index fell 1.4 points to 51.2. The employment index rose 1.0 points to 54.0. The lead times index rose 6.4 points to 51.4. The finished goods inventory index, the underlying indicator that has the strongest inverse correlation with economic activity, fell 1.6 points to 52.1, giving a minimally weaker signal of potential economic contraction.
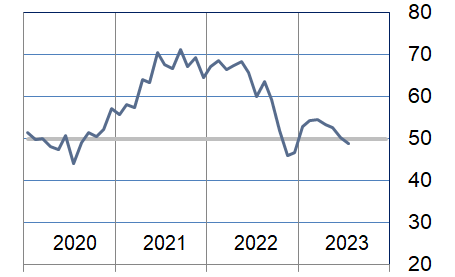
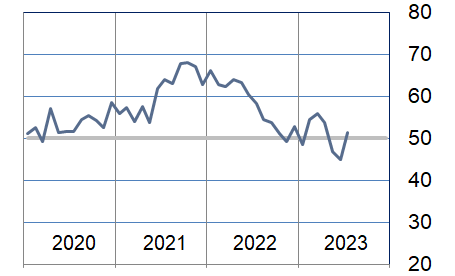
The Houston Manufacturing PMI rose 1.0 points to 47.0, continuing to provide a strong indication of potential overall economic contraction. The nonmanufacturing PMI rose 1.6 points to 53.2, showing a modestly higher expansion rate for the industries in this sector.
On an industry specific basis, oil & gas, construction, health care, trade, transportation & warehousing, professional and management services reported modest expansion. Manufacturing, leisure and hospitality, and real estate continue to report low to moderate contraction.
The Houston PMI provides a measure of current economic activity in the greater Houston area and a forecast of likely shifts in activity over a three-month forecast horizon. These indicators have a possible range of 0 to 100. Readings over 50 generally indicate goods producing industry expansion; readings below 50 show contraction. A PMI above 45 generally correlates with expansion of the Houston-The Woodlands-Sugar Land Business Cycle Index. The current and forecast PMI indices are based on diffusion indices for eight underlying indicators: Sales/New Orders, Production, Employment, Purchases, Prices Paid, Lead Times, Purchase Inventory, and Finished Goods Inventory.
The Houston PMI provides a measure of current economic activity in the greater Houston area and a forecast of likely shifts in activity over a three-month forecast horizon. These indicators have a possible range of 0 to 100. Readings over 50 generally indicate goods producing industry expansion; readings below 50 show contraction. A PMI above 45 generally correlates with expansion of the Houston-The Woodlands-Sugar Land Business Cycle Index. The current and forecast PMI indices are based on diffusion indices for eight underlying indicators: Sales/New Orders, Production, Employment, Purchases, Prices Paid, Lead Times, Purchase Inventory, and Finished Goods Inventory.
Click here to see the PDF version of the full report.
Indices at a Glance
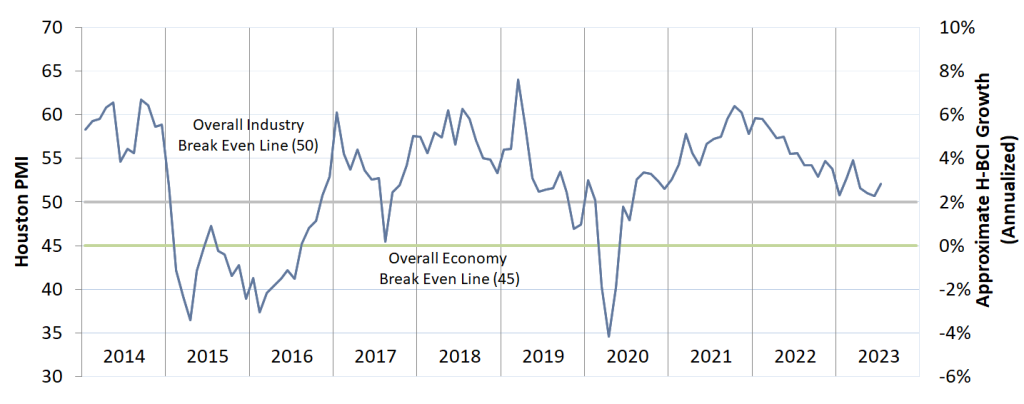
Houston PMI Trend
Houston PMI readings over 50 generally indicate that respondents see their activities as expanding. An HPMI above 45 normally correlates with expansion of the Houston-The Woodlands-Sugar Land Business Cycle Index (H-BCI).
Commodities Reported to have Notable Price Changes or to be in Short Supply
Up in Price: Professional services, skilled labor, rig and fracking labor, craft and general labor; natural gas‡, crude oil, gasoline, diesel, jet fuel; lab supplies; natural gas liquids, ethane, propane, normal butane, isobutane, natural gasoline, naphtha, ethylene, benzene, elastomers; electrical equipment and components, transformers, instrumentation, compressors, premium alloy steel, rebar, structural steel from the US, used equipment and vehicles; electronics, software and hardware; containerized ocean freight‡.
Down in Price: Natural gas‡; proppant, oil field chemicals, ammonia, nitric acid, caustic soda; PVF (pipe, valves, and fittings), high alloy steel, stainless steel, carbon steel, lined pipe, palladium, rhodium, nickel, lumber; truck freight, breakbulk shipping, containerized ocean freight‡.
In Short Supply: Senior consultants, rig and frack labor, skilled labor, craft and general labor, light industrial labor; critical pediatric clinical supplies and medications; fluoropolymers (PFAs); generators, electrical equipment, transformers, power supplies, variable frequency drives, elevators, transfer switches, air conditioners, compressors, high yield steel, cement, some extruded knitting wire, new and used vehicles; electronics, semiconductors; some land-based logistics.
‡ reported as up or down by different respondents
What our Respondents are Saying
Oil and Gas Exploration, and Key Support Services:
- Surety of supply is improving across the board and signs of moderating inflation are emerging; some categories are seeing the possibility of slight deflation in the 4Q-23; very slight tightening of land-based logistics.
- U.S. and Texas rig counts continue to fall.
- This sector expanded at a somewhat higher rate; the employment and purchases indices joined the production index showing strength; the prices paid index returned to neutral joining the lead times and inventory indices at this level.
Construction:
- Lead times remain challenged; lead times for diesel generators have now increased to more than 3 years due to unprecedented demand.
- An IMF report from late July indicated the global inflation rate is falling and is expected to continue the decline into 2024.
- Performance in this sector continued to show modest to strong growth; the employment index pointed to expansion at a rapid pace; the lead times index rose to join all other indices near neutral.
Durable Goods Manufacturing:
- Steady growth in new sales orders in the near future as the demand for oil drilling equipment remains relatively strong.
- Supplier delivery times are improving.
- Material pricing is stabilizing as inflation cools.
- This sector’s performance moved further below neutral again this month with the prices paid and lead times indices joining the sales/new orders index showing significant weakness; the purchases index rose significantly above neutral; inventories were reported to be well above neutral; the production and employment indices came in at neutral.
Non-durable Goods Manufacturing:
- Multiple headwinds related to demand drop in 2H23 for the Chemical Processing industry; most pricing was flat.
- The slowdowns continue in rubber, olefins and housing.
- Blending component input to our gulf coast total refineries is being reduced.
- This sector’s performance stayed near neutral with significant growth in the employment index being offset by much lower sales, production, and purchases indices; finished goods inventories are falling at a rapid pace.
Trade, Transportation, and Warehousing:
- Many capital projects are slated to move forward in Q4.
- We are seeing improvement in computer chip availability.
- Year to date Houston air passenger totals are just below 2019 levels.
- This sector’s indicated good performance again this month with strong expansion of the sales/new orders and purchases indices; all other indices came in just above neutral.
Real-Estate Services:
- Our July [new home] sales were strong; modestly above plan.
- Loan qualification is getting more difficult for some buyers.
- Existing home sales continues to run below last year’s levels.
- Office real estate vacancy rates remain flat at about 25%.
- Light industrial real estate vacancy rates have risen modestly during the first half and are now at about 7%.
- This sector’s performance remained modestly below neutral with new homes reporting above neutral; industrial and retail real estate reported at neutral; office real estate continues to show significant weakness.
Professional and Business Services:
- Rising interest rates and inflationary concerns continue to impact hiring of employees and contractors as company leadership remains concerned over a recession remain in play.
- Layoffs in the professional services industry have become more frequent.
- The Houston market is very stable in terms of companies hiring open positions; not many openings are present, and candidates are reluctant to seek new opportunities.
- Spot areas of technical expertise continue to be tight, but overall, there is a good mixture of supply vs. demand.
- Wage fluctuations have leveled off over the past several months; very steady now and only rare cases of people in a highly professional skilled area receiving salaries outside of normal boundaries.
- As the price of oil inches up (now around $80/barrel compared to $70/barrel two months ago), companies are feeling better and thinking about adding to staff, but not committing as of yet.
- We expect the hourly and professional services compensation to stay steady for the foreseeable future.
- This sector reported modestly higher expansion with the sales/new orders and prices paid indices improving to neutral while the employment index moderated but remained above neutral; the purchases and lead-time indices rose to well above neutral.
Health Care:
- Certain pediatric clinical supplies and medications are in high demand causing major backorder issues; one of the main reasons for this increase in demand was the possibility of a strike by UPS due to a breakdown in negotiations with the Teamsters (which has now been averted); many facilities were bulk purchasing critical products.
- Business is very good, and we continue to expand.
- Final notice came in April that Medicare will be making major cuts to reimbursement rates: one cut is scheduled for next year and another the year after; this will hit the bottom line of every healthcare medical company; cost cutting is happening as a result; our hiring is frozen unless needed for expansion on the medical side; all administrative roles have been put on hold; non-growing healthcare companies are making cuts to counteract the drop in revenue from the final notice.
- We are seeing big improvement in air conditioner lead times.
- This sector returned to reporting modest to strong growth; the sales/new orders, purchases, and lead times indices showed continued strength while the employment index joined inventory indices showing considerable weakness.
Government:
- Hiring qualified staff is still an issue.
- Our ability to fulfill orders for vehicles is still a challenge.
- Construction costs are still increasing, causing projects to be reduced in scope.
- This sector’s performance rose to near neutral with all indices except prices paid reporting at this level. The prices paid index is now pointing to potential significant contraction.
Trend of Underlying Indicators
The Houston PMI is based on diffusion indices for eight underlying indicators. The net value of each indicator is simply the percentage of respondents who cite a positive shift from the previous month minus the percentage who cite a negative shift. The diffusion index is calculated based on the percent of respondents reporting higher results plus one-half of those responding the same with seasonal adjustments to the Sales/New Orders, Production, Employment, and Prices Paid indices based on an X13 ARIMA forecast. Values above 50 for Sales/New Orders, Production, Employment, Prices Paid, and Lead Times generally point towards expansion and values below 50 signal contraction. Note that the Prices Paid Index may not follow this trend late in an economic expansion. The Inventory measures have an inverse correlation at most forecast horizons, meaning that values below 50 point to expansion and values above point to contraction. The Purchases index is inversely correlated with economic activity at the three-month forecast horizon.
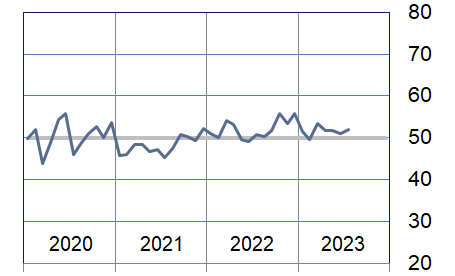
Sales/New Orders (Seasonally Adjusted)
The sales/new orders index expanded at a moderately slower rate during the month. Nonmanufacturing expanded at a similar rate while manufacturing continued to contraction at a significant pace.
| Higher | Same | Lower | Net | Index | |
| Feb/23 | 10% | 85% | 5% | 5% | 51.4 |
| Mar/23 | 17% | 76% | 7% | 10% | 54.7 |
| Apr/23 | 12% | 81% | 7% | 5% | 49.6 |
| May/23 | 19% | 75% | 6% | 13% | 54.9 |
| Jun/23 | 11% | 80% | 9% | 2% | 52.9 |
| Jul/23 | 13% | 75% | 12% | 1% | 51.2 |

Production Index (Seasonally Adjusted)
The production index was relatively unchanged again this month. Nonmanufacturing performance expanded at a minimally faster rate while manufacturing showed contracted at a faster pace.
| Higher | Same | Lower | Net | Index | |
| Feb/23 | 9% | 86% | 5% | 4% | 51.8 |
| Mar/23 | 13% | 80% | 7% | 6% | 53.2 |
| Apr/23 | 9% | 85% | 6% | 3% | 48.2 |
| May/23 | 11% | 86% | 3% | 8% | 53.8 |
| Jun/23 | 11% | 83% | 6% | 5% | 54.0 |
| Jul/23 | 17% | 74% | 9% | 8% | 53.9 |
Employment Index (Seasonally Adjusted)
The employment index improved minimally. Nonmanufacturing continued to expand at a similar rate to last month while manufacturing indicated a higher expansion rate.
| Higher | Same | Lower | Net | Index | |
| Feb/23 | 13% | 81% | 6% | 7% | 53.2 |
| Mar/23 | 23% | 69% | 8% | 15% | 56.7 |
| Apr/23 | 18% | 78% | 4% | 14% | 53.1 |
| May/23 | 12% | 80% | 8% | 4% | 51.1 |
| Jun/23 | 15% | 80% | 5% | 10% | 53.0 |
| Jul/23 | 14% | 82% | 4% | 10% | 54.0 |
Purchases Index (Not Seasonally Adjusted)
The purchases index pointed to expansion at a modestly higher rate. Nonmanufacturing continued to expand at a rapid pace while manufacturing continued to show a significant rate of contraction.
| Higher | Same | Lower | Net | Index | |
| Feb/23 | 15% | 83% | 2% | 13% | 56.5 |
| Mar/23 | 16% | 79% | 5% | 11% | 55.5 |
| Apr/23 | 17% | 74% | 9% | 8% | 54.1 |
| May/23 | 19% | 77% | 4% | 15% | 57.4 |
| Jun/23 | 14% | 80% | 6% | 8% | 54.3 |
| Jul/23 | 19% | 73% | 8% | 11% | 55.7 |
Prices Paid Index (Seasonally Adjusted)
The prices paid index fell to below neutral led by moderate contraction in the nonmanufacturing sectors. Manufacturing reported strong price growth.
| Higher | Same | Lower | Net | Index | |
| Feb/23 | 16% | 81% | 3% | 13% | 54.3 |
| Mar/23 | 24% | 69% | 7% | 17% | 54.6 |
| Apr/23 | 11% | 85% | 4% | 7% | 53.3 |
| May/23 | 13% | 78% | 9% | 4% | 52.6 |
| Jun/23 | 9% | 77% | 14% | -5% | 50.3 |
| Jul/23 | 8% | 82% | 10% | -2% | 48.9 |
Lead Times Index (Not Seasonally Adjusted)
The lead times index rose back above neutral during the month. Nonmanufacturing reported this index returned to indicating modest expansion while manufacturing is still reporting shorter lead times.
| Higher | Same | Lower | Net | Index | |
| Feb/23 | 13% | 82% | 5% | 8% | 54.4 |
| Mar/23 | 20% | 71% | 9% | 11% | 55.9 |
| Apr/23 | 12% | 83% | 5% | 7% | 53.8 |
| May/23 | 8% | 78% | 14% | -6% | 46.9 |
| Jun/23 | 5% | 80% | 15% | -10% | 45.0 |
| Jul/23 | 12% | 79% | 9% | 3% | 51.4 |
Purchased Inventory Index (Not Seasonally Adjusted)
The purchased inventory index rose modestly with manufacturing moving from contraction to significant expansion. This index fell minimally to near neutral for nonmanufacturing.
| Higher | Same | Lower | Net | Index | |
| Feb/23 | 6% | 88% | 6% | 0% | 49.6 |
| Mar/23 | 10% | 86% | 4% | 6% | 53.4 |
| Apr/23 | 12% | 79% | 9% | 3% | 51.9 |
| May/23 | 8% | 88% | 4% | 4% | 51.9 |
| Jun/23 | 8% | 86% | 6% | 2% | 51.0 |
| Jul/23 | 8% | 88% | 4% | 4% | 52.0 |
Finished Goods Inventory Index (Not Seasonally Adjusted)
The purchased inventory index moderated minimally. Nonmanufacturing reported a modestly lower tendency towards economic contraction while manufacturing continues to point to a fast rate of economic contraction.
| Higher | Same | Lower | Net | Index | |
| Feb/23 | 5% | 89% | 6% | -1% | 49.1 |
| Mar/23 | 16% | 80% | 4% | 12% | 56.1 |
| Apr/23 | 11% | 85% | 4% | 7% | 53.3 |
| May/23 | 9% | 88% | 3% | 6% | 53.0 |
| Jun/23 | 10% | 87% | 3% | 7% | 53.7 |
| Jul/23 | 9% | 86% | 5% | 4% | 52.1 |
Background on the ISM-Houston Business Report and HPMI Calculation Methods
The Houston Purchasing Managers Index has been included as an integral part of the ISM-Houston Business Report since the Houston chapter of the Institute for Supply Management started publication of this document in January 1995. The report and index are published monthly as the primary deliverables from a survey of Houston area Supply Chain leaders regarding the status of key activities believed to provide insight into the strength of the economy. The respondents come from diverse organizations including construction, energy, engineering, health care, durable and non-durable goods manufacturing, financial and business services, wholesale and retail trade, and utilities related companies.
The Houston Purchasing Managers Index is determined from diffusion indices of the eight indicators of economic activity covered by the ISM-Houston Business Survey and Report. These underlying indicators are sales or new orders, production, employment, purchases, prices paid for major purchases, lead times from sellers, purchased materials inventory (raw materials and supplies), and finished goods inventories. The respondents to the survey report the direction of each these activities as either up, the same or down in comparison to the previous month. An index for each of these areas is then calculated by subtracting the percentage of respondents that sight a negative shift from the percentage that sight a positive shift. For indicators that are positively correlated with economic growth, this results in an underlying index that points to expansion when it is above zero. Indicators that are negatively correlated with growth point to expansion when they are below zero.
The final Houston PMI is calculated by applying optimal regression factors to each of the eight underlying indicators noted above. These regression factors are determined using standard regression techniques comparing these underlying indicators to the Houston-The Woodlands-Sugar Land Business Cycle Index (Houston BCI), which is reported on a monthly basis by the Federal Reserve Bank of Dallas. This top-level index is converted to a 0 to 100 scale to match that of the national Purchasing Managers Index® (PMI®) which is published monthly by the Institute for Supply Management® (ISM®). Readings over 50 for the HPMI generally indicate manufacturing expansion in the Houston in the near term and readings below 50 show coming manufacturing contraction.
It is important to note that the manufacturing breakeven HPMI does not equate to the breakeven point for the overall Houston economy. ISM-Houston periodically reviews the capability of its correlations and adjusts the regression factors when appropriate. The most recent revision occurred as a result of a review undertaken during the third quarter of 2018, which determined that changes in the Houston economy over the last decade have shifted the intercept of the correlation, causing a neutral Houston PMI to no longer align with a neutral Houston BCI. A Houston PMI of 45 points now equates to a neutral Houston economy as measured by the Houston BCI. A similar offset between the National PMI and the National economy has existed for some time.
Use of ISM-Houston Business Report Content
All information contained in this report is protected by copyright laws and ISM-Houston retains all rights to this Content. ISM-Houston hereby grants you a limited, revocable license to access, print, and display this Content solely for your personal, non-commercial use. Requests for permission to reproduce or redistribute ISM-Houston Business Report Content can be made by contacting the ISM-Houston Business Survey Committee at hpmi@ism-houston.org.
ISM-Houston shall not have any liability, duty, or obligation for or relating to the ISM-Houston Business Report Content or other information contained herein, any errors, inaccuracies, omissions or delays in providing any ISM-Houston Business Report Content, or for any actions taken in reliance thereon. In no event shall ISM-Houston be liable for any special, incidental, or consequential damages, arising out of the use of the ISM-Houston Business Report.