
For release May 10, 2024
Houston PMI at 50.3 (down 0.2 points)
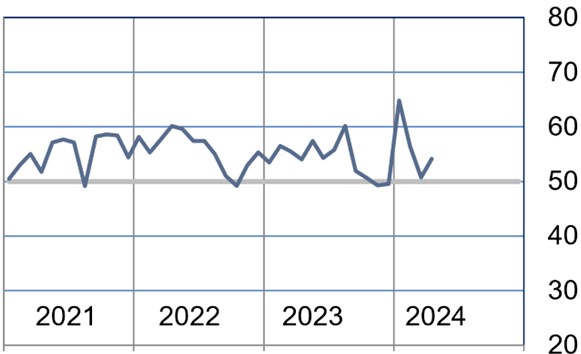
Sales/New Orders Expanding
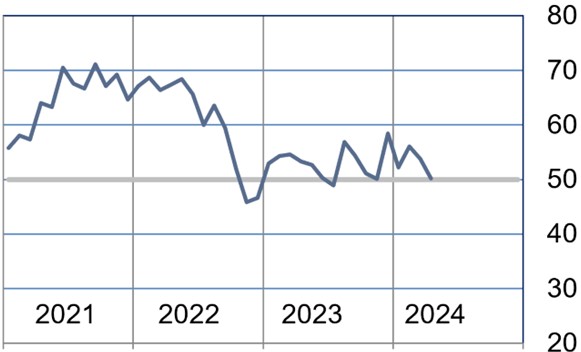
Production Expanding
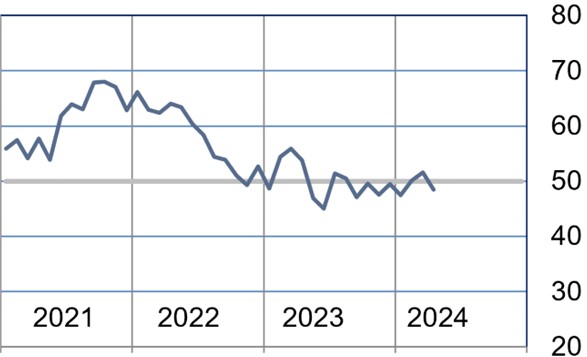
Employment Contracting
Prices Paid Expanding
Lead Times Contracting
Finished Goods Inventories Contracting
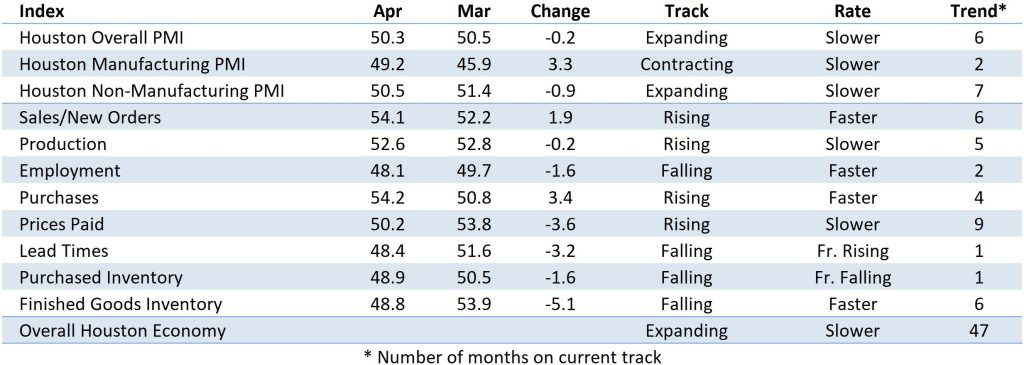
(Houston, Texas) – According to Houston area supply chain executives, economic activity in Houston showed mixed results in April. The overall PMI expanded, with the nonmanufacturing sector expanding the and the manufacturing sector indicating contraction slight contraction.
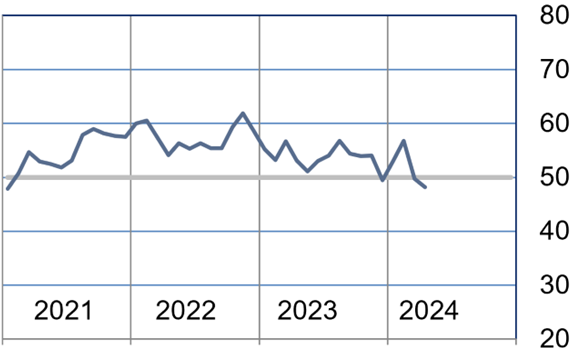
The Houston Purchasing Managers Index expanded at a slower rate, down 0.2 points to 50.3. The sales/new order index, one of three indicators with a strong positive correlation with economic activity, saw expansion. Sales/New orders expanded to 54.1 points. The other two indicators, lead times and employment, both contracted. Employment continued its three month slide at 48.1 points. Lead times slipped back into contraction at 48.4 points. The finished goods inventory index, the underlying indicator that has the strongest inverse correlation with economic activity, also contracted to 48.8 points.
The Houston Manufacturing PMI improved month over month; however, still contracted in the month of April arriving at 49.2 points. The nonmanufacturing PMI expanded at a slower rate than March, finishing at 50.5 points.
On an industry specific basis: technical services, utilities, health care, and nondurable goods manufacturing reported strong expansion. Oil and gas extraction and durable goods manufacturing showed relative weakness.
Click here to see the PDF version of the full report.
Indices at a Glance
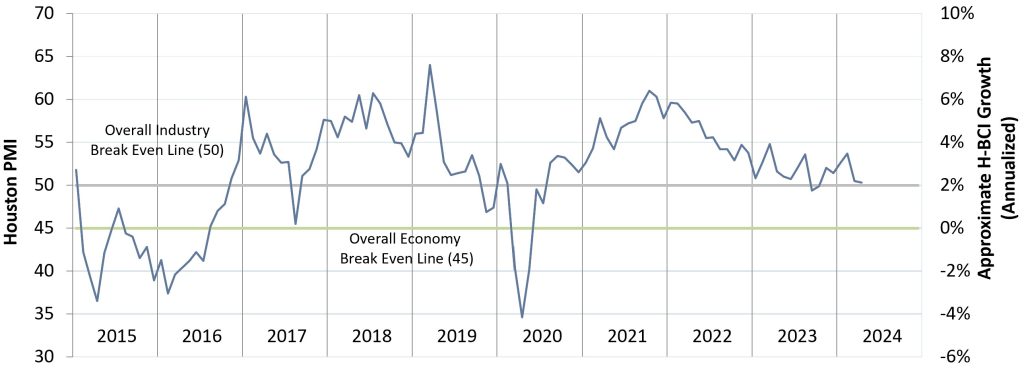
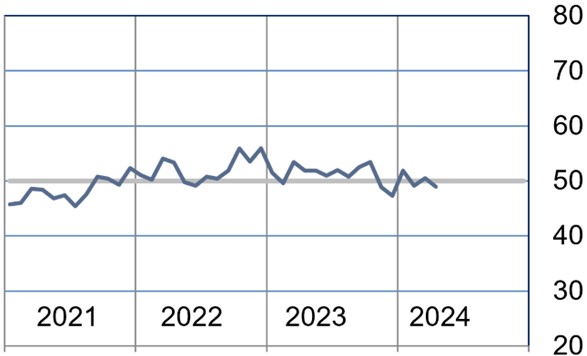
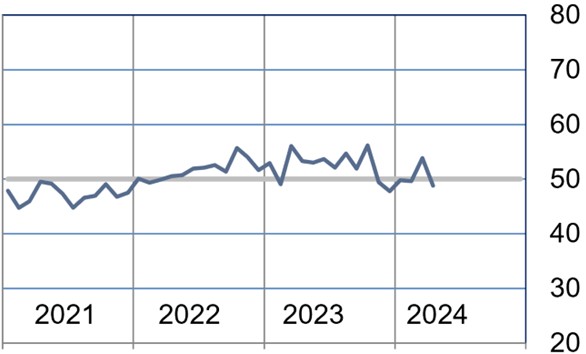
Houston PMI Trend
Houston PMI readings over 50 generally indicate that respondents see their activities as expanding. An HPMI above 45 normally correlates with expansion of the Houston-The Woodlands-Sugar Land Business Cycle Index (H-BCI).
Commodities Reported to have Notable Price Changes or to be in Short Supply
Up in Price: Craft labor, commodity chemicals, Inconel, copper, stainless steel, switchgear, elastomers, electrical gear and components, electronics‡, fleet vehicles, used equipment
Down in Price: Logistics services, freight, electricity, steel, proppant, carbon alloy steel, Oil Country Tubular Goods (OCTG), drilling equipment, electronics‡
In Short Supply: Fluoropolymers (PFAs), industrial gasses, industrial acids, Inconel, electrical steel, switchgear, compressors, electrical instrumentation, automation equipment, electrical gear, generators, Teflon wiring, poly wiring
‡ reported as up or down by different respondents
What our Respondents are Saying
Oil and Gas Exploration, and Key Support Services:
- Data is starting to show real softening specific areas where vendors wouldn’t budge 9 months ago, particularly around logistics and storage.
- This sector continues to contract this month at roughly the same rate as the previous month. The sales, production, employment and purchasing indexes all show significant contraction.
Construction:
- Construction continues to show modest to strong growth. The employment, sales and lead time indexes continue to show expansion with the sales index also moving into the significant expansion range. The production index is the only underlying factor not pointing to expansion for the month of April.
Durable Goods Manufacturing:
- Demand for our line of oil & gas drilling equipment has been softer compared to this time a year ago.
- This sector contracted at a slower pace month over month. The performance is driven by expansion in the sales and production indexes but hampered by significant contraction in the employment index.
Non-durable Goods Manufacturing:
- Seeing steady pricing for MRO materials at manufacturing sites, mainly driven by stable steel pricing.
- This sector’s saw modest expansion in April driven rising sales/new orders, and production. Expansion was hampered by a weak employment index, contracting lead times and finished goods inventories.
Trade, Transportation, and Warehousing:
- No commodities identified in short supply; we have seen supply improvements.
- We expect inflationary pressures to persist as demand increase driven by our seasonal turnarounds and capital projects.
- This sector slight contraction in April, driven by slight contractions in the sales, employment and production, indexes.
Professional and Business Services:
- We continue to see a steady demand and supply situation for both our contract staffing or direct hire opportunities from our clients. We continue to see good balance of demand (clients adding to staff) compared with professionals willing to make a change to a new company.
- We continue to see a resistance for companies to greatly expand their staffs. Certainly, there will be spots to fill as normal attrition takes place. We don’t see companies greatly expanding their staffs. It “appears” that many companies are holding back to see (1) what the general economy will be doing, and (2) what impact the general election in November will have. Even though this survey is intended to be Houston area, the Energy Industry is waiting to see if the election will result in either a trend towards reducing fossil fuels or increasing the dependence on fossil fuels and putting Alternative Energy in a supplemental rather than primary role.
- The prices continue to remain basically unchanged for the past several months. In general, no significant movement in prices paid and we expect this trend to continue.
- The majority of commodities are returning to normal supply
- This sector indicated expansion this month with all eight underlying indexes pointing to expansion.
Health Care:
- Still long lead time on construction things like elevators, ACs and generators.
- First months after second final notice on MA adjustment rates. Layoffs are happening as MA rates are climbing and healthcare is trying to curb expenses. Expansion has slowed down to conserve capital money for 2024 and projects are being pushed to 2025-26. But still happening.
- Pretty much everyone is trying g to raise prices. Especially with inflation still around and not dropping.
- The sector reported significant expansion this month. The purchased inventory and full goods inventory fell from expansion to significant contraction.
Trend of Underlying Indicators
The Houston PMI is based on diffusion indices for eight underlying indicators. The net value of each indicator is simply the percentage of respondents who cite a positive shift from the previous month minus the percentage who cite a negative shift. The diffusion index is calculated based on the percent of respondents reporting higher results plus one-half of those responding the same with seasonal adjustments to the Sales/New Orders, Production, Employment, and Prices Paid indices based on an X13 ARIMA forecast. Values above 50 for Sales/New Orders, Production, Employment, Prices Paid, and Lead Times generally point towards expansion and values below 50 signal contraction. Note that the Prices Paid Index may not follow this trend late in an economic expansion. The Inventory measures have an inverse correlation at most forecast horizons, meaning that values below 50 point to expansion and values above point to contraction. The Purchases index is inversely correlated with economic activity at the three-month forecast horizon.
Sales/New Orders (Seasonally Adjusted)
The sales/new orders index expanded at a faster rate with both manufacturing and nonmanufacturing sectors expanding. Manufacturing expanding significantly faster than March.
| Higher | Same | Lower | Net | Index | |
| Nov/23 | 8% | 84% | 8% | 0% | 52.8 |
| Dec/23 | 7% | 87% | 6% | 1% | 55.1 |
| Jan/24 | 21% | 77% | 2% | 19% | 56.3 |
| Feb/24 | 14% | 80% | 6% | 8% | 52.8 |
| Mar/24 | 14% | 77% | 9% | 5% | 52.2 |
| Apr/24 | 22% | 71% | 7% | 15% | 54.1 |
Production Index (Seasonally Adjusted)
The production index remained flat month over month. The manufacturing sector showed strong expansion while the nonmanufacturing sector slipped into contraction.
| Higher | Same | Lower | Net | Index | |
| Nov/23 | 5% | 88% | 7% | -2% | 49.9 |
| Dec/23 | 8% | 84% | 8% | 0% | 50.6 |
| Jan/24 | 13% | 86% | 1% | 12% | 56.1 |
| Feb/24 | 12% | 85% | 3% | 9% | 55.2 |
| Mar/24 | 9% | 86% | 5% | 4% | 52.8 |
| Apr/24 | 14% | 83% | 3% | 11% | 52.6 |
Employment Index (Seasonally Adjusted)
The employment index accelerated its contraction this month, primarily driven by a dramatic drop in the manufacturing sector. Nonmanufacturing saw a slight expansion.
| Higher | Same | Lower | Net | Index | |
| Nov/23 | 5% | 92% | 3% | 2% | 54.0 |
| Dec/23 | 4% | 89% | 7% | -3% | 49.4 |
| Jan/24 | 17% | 77% | 6% | 11% | 52.9 |
| Feb/24 | 15% | 79% | 6% | 9% | 56.8 |
| Mar/24 | 8% | 80% | 12% | -4% | 49.7% |
| Apr/24 | 6% | 87% | 7% | -1% | 48.1 |
Purchases Index (Not Seasonally Adjusted)
The purchases index expanded at a faster rate in April. The manufacturing sector, which already had strong expansion, expanded slightly faster. The nonmanufacturing sector expanded but at a slower rate than March.
| Higher | Same | Lower | Net | Index | |
| Nov/23 | 7% | 84% | 9% | -2% | 49.3 |
| Dec/23 | 8% | 83% | 9% | -1% | 49.6 |
| Jan/24 | 32% | 65% | 3% | 29% | 64.8 |
| Feb/24 | 17% | 79% | 4% | 13% | 56.4 |
| Mar/24 | 11% | 80% | 9% | 2% | 50.8 |
| Apr/24 | 14% | 80% | 6% | 8% | 54.2 |
Prices Paid Index (Seasonally Adjusted)
The prices paid index remained just above neutral for the month of April. The manufacturing sector went from contraction to expansion while the nonmanufacturing sector slightly contracted.
| Higher | Same | Lower | Net | Index | |
| Nov/23 | 3% | 92% | 5% | -2% | 50.2 |
| Dec/23 | 14% | 84% | 2% | 12% | 58.5 |
| Jan/24 | 11% | 83% | 6% | 5% | 52.2 |
| Feb/24 | 12% | 83% | 5% | 7% | 56.1 |
| Mar/24 | 12% | 84% | 4% | 8% | 53.8 |
| Apr/24 | 6% | 90% | 4% | 2% | 50.2 |
Lead Times Index (Not Seasonally Adjusted)
The lead times index contracted due to a sharp decline in the manufacturing sector. It lost 15 points from its neutral position in March. Nonmanufacturing saw slight expansion.
| Higher | Same | Lower | Net | Index | |
| Nov/23 | 4% | 87% | 9% | -5% | 47.5 |
| Dec/23 | 3% | 93% | 4% | -1% | 49.5 |
| Jan/24 | 1% | 93% | 6% | -5% | 47.5 |
| Feb/24 | 4% | 92% | 4% | 0% | 50.1 |
| Mar/24 | 6% | 91% | 3% | 3% | 51.6 |
| Apr/24 | 5% | 87% | 8% | -3% | 48.4 |
Purchased Inventory Index (Not Seasonally Adjusted)
The purchased inventory index contracted in April due to contraction in the nonmanufacturing sector. The manufacturing sector was neutral.
| Higher | Same | Lower | Net | Index | |
| Nov/23 | 3% | 91% | 6% | -3% | 48.8 |
| Dec/23 | 2% | 91% | 7% | -5% | 47.3 |
| Jan/24 | 5% | 93% | 2% | 3% | 51.8 |
| Feb/24 | 3% | 92% | 5% | -2% | 49.1 |
| Mar/24 | 8% | 85% | 7% | 1% | 50.5 |
| Apr/24 | 4% | 90% | 6% | -2% | 48.9 |
Finished Goods Inventory Index (Not Seasonally Adjusted)
The finished goods inventory index saw slight contraction. The manufacturing index contracted faster than the previous month. The nonmanufacturing remained unchanged with a slight expansion.
| Higher | Same | Lower | Net | Index | |
| Nov/23 | 5% | 89% | 6% | -1% | 49.4 |
| Dec/23 | 4% | 88% | 8% | -4% | 47.7 |
| Jan/24 | 5% | 90% | 5% | 0% | 49.8 |
| Feb/24 | 5% | 90% | 5% | 0% | 49.6 |
| Mar/24 | 11% | 86% | 3% | 8% | 53.9 |
| Apr/24 | 6% | 85% | 9% | -3% | 48.8 |
Background on the ISM-Houston Business Report and HPMI Calculation Methods
The Houston Purchasing Managers Index has been included as an integral part of the ISM-Houston Business Report since the Houston chapter of the Institute for Supply Management started publication of this document in January 1995. The report and index are published monthly as the primary deliverables from a survey of Houston area Supply Chain leaders regarding the status of key activities believed to provide insight into the strength of the economy. The respondents come from diverse organizations including construction, energy, engineering, health care, durable and non-durable goods manufacturing, financial and business services, wholesale and retail trade, and utilities related companies.
The Houston Purchasing Managers Index is determined from diffusion indices of the eight indicators of economic activity covered by the ISM-Houston Business Survey and Report. These underlying indicators are sales or new orders, production, employment, purchases, prices paid for major purchases, lead times from sellers, purchased materials inventory (raw materials and supplies), and finished goods inventories. The respondents to the survey report the direction of each these activities as either up, the same or down in comparison to the previous month. An index for each of these areas is then calculated by subtracting the percentage of respondents that sight a negative shift from the percentage that sight a positive shift. For indicators that are positively correlated with economic growth, this results in an underlying index that points to expansion when it is above zero. Indicators that are negatively correlated with growth point to expansion when they are below zero.
The final Houston PMI is calculated by applying optimal regression factors to each of the eight underlying indicators noted above. These regression factors are determined using standard regression techniques comparing these underlying indicators to the Houston-The Woodlands-Sugar Land Business Cycle Index (Houston BCI), which is reported on a monthly basis by the Federal Reserve Bank of Dallas. This top-level index is converted to a 0 to 100 scale to match that of the national Purchasing Managers Index® (PMI®) which is published monthly by the Institute for Supply Management® (ISM®). Readings over 50 for the HPMI generally indicate manufacturing expansion in the Houston in the near term and readings below 50 show coming manufacturing contraction.
It is important to note that the manufacturing breakeven HPMI does not equate to the breakeven point for the overall Houston economy. ISM-Houston periodically reviews the capability of its correlations and adjusts the regression factors when appropriate. The most recent revision occurred as a result of a review undertaken during the third quarter of 2018, which determined that changes in the Houston economy over the last decade have shifted the intercept of the correlation, causing a neutral Houston PMI to no longer align with a neutral Houston BCI. A Houston PMI of 45 points now equates to a neutral Houston economy as measured by the Houston BCI. A similar offset between the National PMI and the National economy has existed for some time.
Use of ISM-Houston Business Report Content
All information contained in this report is protected by copyright laws and ISM-Houston retains all rights to this Content. ISM-Houston hereby grants you a limited, revocable license to access, print, and display this Content solely for your personal, non-commercial use. Requests for permission to reproduce or redistribute ISM-Houston Business Report Content can be made by contacting the ISM-Houston Business Survey Committee at hpmi@ism-houston.org.
ISM-Houston shall not have any liability, duty, or obligation for or relating to the ISM-Houston Business Report Content or other information contained herein, any errors, inaccuracies, omissions or delays in providing any ISM-Houston Business Report Content, or for any actions taken in reliance thereon. In no event shall ISM-Houston be liable for any special, incidental, or consequential damages, arising out of the use of the ISM-Houston Business Report.